Style google maps dynamically with Data-driven styling
In this tutorial you will learn how to style a google vector map dynamically with Data Driven Styling.
Tags: Vue 3, Typescript, Google Maps JS, Vector Maps, Data driven Styling, GeoJson
Time to read: 10 min
Prerequisites
- Familiarity with the command line
- Install Node.js version 16.0 or higher
- Google Maps JS API key and a MapID of type Vector / Javascript. Read how to get it here
- Enable FeatureLayers "Country" and "Administrative Area Level 1" in Map Styles. Read more on how to do it here
Setup project
We will focus on the actual data driven styling functionality, so to save us some time we will begin from a scaffold application.
Run below commands in the command line to get the scaffold app.
mkdir dd-styling-app && cd dd-styling-app
npx degit crunchwrap89/map-app-scaffold
npm i
npm run dev
Now you can visit http://127.0.0.1:5000/
For the map to work fully you must add a .env file that holds the apikey and mapid in the same way as shown in the .env.example file.
Add Map Styling Composable
Create a new file: src/composables/useMapStyling.ts
add the below code to the file:
export function useMapStyling(): {
  setMapStyling(map: google.maps.Map): void;
} {
  function setMapStyling(map: google.maps.Map) {
    const countryLayer = map.getFeatureLayer(google.maps.FeatureType.COUNTRY);
    const cityLayer = map.getFeatureLayer(google.maps.FeatureType.ADMINISTRATIVE_AREA_LEVEL_1);

    cityLayer.style = (placeFeature: any) => {
      const population = states[placeFeature.feature.displayName];

      let fillColor;

      if (population < 2000000) {
        fillColor = '#E64848';
      } else if (population < 5000000) {
        fillColor = '#ffb813';
      } else if (population < 10000000) {
        fillColor = '#24BAB9';
      } else if (population < 40000000) {
        fillColor = '#52ab8a';
      }
      return {
        fillColor,
        fillOpacity: 0.5,
      };
    };

    countryLayer.style = (placeFeature: any) => {
      const population = countries[placeFeature.feature.displayName];

      let fillColor;

      if (population < 2000000) {
        fillColor = '#3f4856';
      } else if (population < 5000000) {
        fillColor = '#4c3e50';
      } else if (population < 10000000) {
        fillColor = '#ceffe1';
      } else if (population < 40000000) {
        fillColor = '#52ab8a';
      }
      return {
        fillColor,
        fillOpacity: 0.5,
      };
    };

    const countries: any = {
      Sweden: 10359877,
      Iran: 732673,
      Norway: 3123123,
      Denmark: 532324,
      Iceland: 92391,
    };

    // Population data by state.
    const states: any = {
      Alabama: 5039877,
      Alaska: 732673,
      Arizona: 7276316,
      Arkansas: 3025891,
      California: 39237836,
      Colorado: 5812069,
      Connecticut: 3605597,
      Delaware: 1003384,
      Florida: 21781128,
      Georgia: 10799566,
      Hawaii: 1441553,
      Idaho: 1900923,
      Illinois: 12671469,
      Indiana: 6805985,
      Iowa: 3193079,
      Kansas: 2934582,
      Kentucky: 4509394,
      Louisiana: 4624047,
      Maine: 1372247,
      Maryland: 6165129,
      Massachusetts: 6984723,
      Michigan: 10050811,
      Minnesota: 5707390,
      Mississippi: 2949965,
      Missouri: 6168187,
      Montana: 1104271,
      Nebraska: 1963692,
      Nevada: 3143991,
      'New Hampshire': 1388992,
      'New Jersey': 9267130,
      'New Mexico': 2115877,
      'New York': 19835913,
      'North Carolina': 10551162,
      'North Dakota': 774948,
      Ohio: 11780017,
      Oklahoma: 3986639,
      Oregon: 4246155,
      Pennsylvania: 12964056,
      'Rhode Island': 1095610,
      'South Carolina': 5190705,
      'South Dakota': 895376,
      Tennessee: 6975218,
      Texas: 29527941,
      Utah: 3337975,
      Vermont: 645570,
      Virginia: 8642274,
      Washington: 7738692,
      'West Virginia': 1782959,
      Wisconsin: 5895908,
      Wyoming: 578803,
      Berlin: 500000,
    };
  }

  return {
    setMapStyling,
  };
}
Too much time indoors, in front of the computer? Find an activity to do Outside at GeoQuestr.com
Init map styling on TheMap component
Open up TheMap component in src/components/TheMap.vue and add the following code to the file:
<script setup lang="ts">
  import {initMap} from "@/utils/mapUtils"; import {tilesLoaded} from "@/utils/mapUtils"; import {useMapStyling} from
  "@/composables/useMapStyling"; const map = await initMap("map-mount"); const {setMapStyling} = useMapStyling(); await
  tilesLoaded(map); setMapStyling(map);
</script>
Change to Beta Channel
As of writing this blog post, data driven styling is only available as a preview in the Beta channel. So you must also change the version in API_SETTINGS to:
version: "beta".
go to src/constants/mapConfig.ts and replace with the following code:
export const API_SETTINGS: APITYPE = {
  apiKey: import.meta.env.VITE_GM_K,
  mapIds: [import.meta.env.VITE_GM_MAPIDS],
  region: 'US',
  language: 'EN',
  version: 'beta',
};

export const MAP_SETTINGS = {
  tilt: 67.5,
  heading: 0,
  zoom: 4,
  center: {
    lat: 0,
    lng: 0,
  },
  restriction: {
    latLngBounds: { north: 85, south: -85, west: -180, east: 180 },
  },
  mapId: import.meta.env.VITE_GM_MAPID,
  disableDefaultUI: true,
  draggable: true,
  zoomControl: false,
  isFractionalZoomEnabled: true,
  gestureHandling: 'greedy',
};
Run it
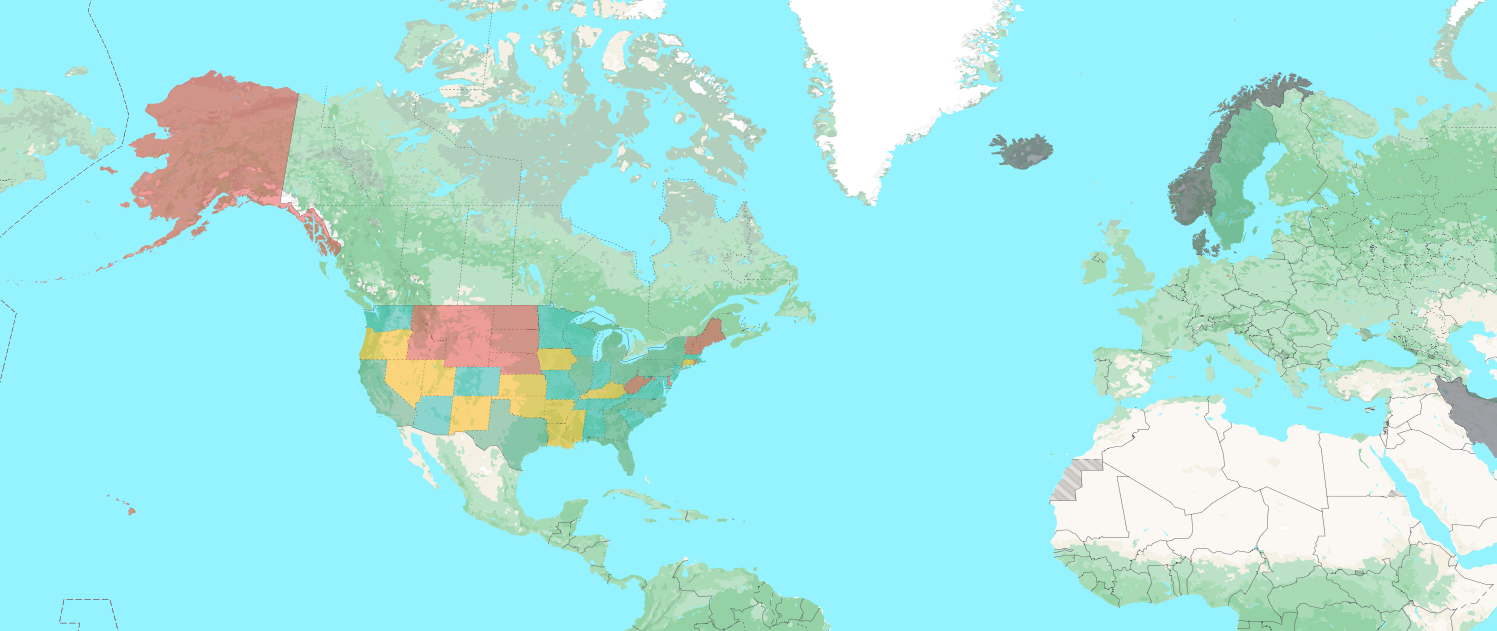
Now if you do npm run dev you should see that all states in america has been assigned fill and border colors based on how big the population is per state.
Since we only activated Country and Administrative Area Level 1 as featuretypes on our MapID styling, we can only style those muncipalities. However you may activate other feature types depending what type of muncipalies you need to style.
There will be a few min delay before being able to use newly added feature types. Be sure to do a full clean of your cookies & cache if you need to add more aswell.
Did you like this tutorial?
You can support me, so that i can continue to make more tutorials like this one.