An Analytics Dashboard With No Analytics API: Nuxt 4 + TypeScript + DuckDB-Wasm + Parquet + Observable Plot
Every dashboard I've built has the same shape. Five charts, a date range, a couple of dropdowns. Behind them, five endpoints that are all the same GROUP BY with different columns, a caching layer to stop the database melting, and a stack of tickets that all read "can we also break this down by X". Every new question is a deploy.
The thing that makes that architecture necessary is the assumption that the data has to stay on the server. For a genuinely large table it does. But an awful lot of dashboards are drawn from a few million rows that change once a night, and a few million rows is not big. Five million rows of trip data, six columns, compressed with zstd, is a file smaller than a short video clip. You could just send it.
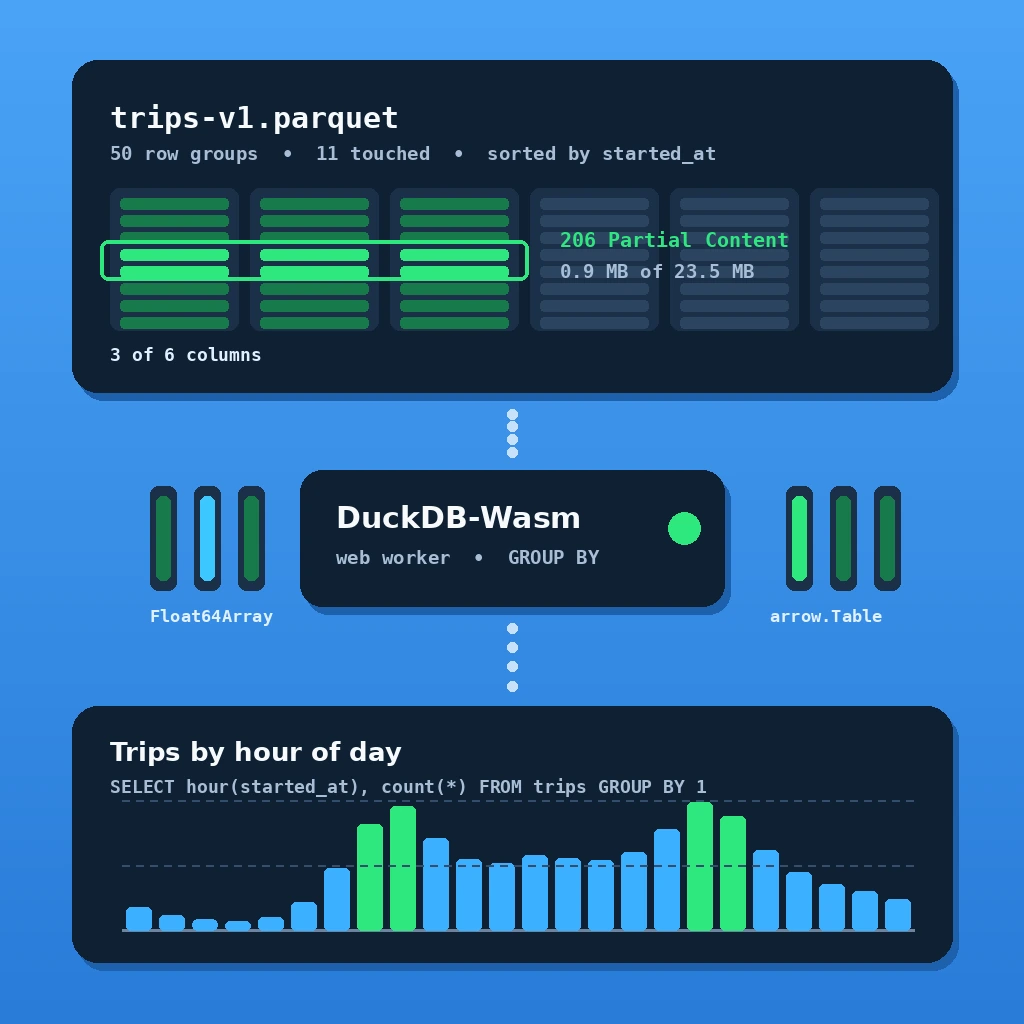
That sentence used to be a joke, because "just send it" meant parsing a couple of hundred megabytes of CSV into JavaScript objects and watching the tab die. What changed is that the whole path from disk to pixels is now columnar, end to end, and nothing in the middle ever materialises a row. Parquet on the wire, Apache Arrow in memory, Observable Plot reading Arrow vectors as chart channels, and DuckDB-Wasm doing real vectorised SQL between them. That's the build.
Tags: Nuxt 4, DuckDB-Wasm, Parquet, Apache Arrow, Observable Plot, TypeScript
Time to read: 22 min
What you'll build: a Nuxt 4 route with five charts over 5,000,000 rows, where clicking a bar cross-filters every other chart in a few tens of milliseconds, a typical query downloads under a megabyte of a 23.5 MB file, and the app contains exactly zero aggregation endpoints.
Why this combination
Four pieces, and the reason they fit is one property they happen to share.
Parquet is columnar on disk, and — the part people forget — it is self-describing and seekable. The footer holds the schema plus min/max statistics for every column of every row group. Which means a reader that can issue HTTP range requests can read the footer, decide that 47 of your 50 row groups cannot possibly contain a row matching started_at >= '2026-03-01', and never fetch them. Sorting the file before you write it is what turns that from a theoretical capability into a 25× reduction in bytes transferred.
DuckDB-Wasm is the reader. It's DuckDB compiled to WebAssembly, running in a Web Worker, with a Wasm-flavoured httpfs built in — so SELECT ... FROM 'https://…/trips.parquet' does exactly the ranged fetch described above, and then runs a vectorised hash aggregate over the result. It is a real analytical database, not a query-shaped API over an array. Window functions, QUALIFY, PIVOT, ASOF JOIN, approximate quantiles — all of it, in the tab.
Apache Arrow is the handoff. DuckDB's in-memory format and Arrow's are close enough that results come back as an arrow.Table of column vectors, and vector.toArray() on a numeric column gives you a Float64Array backed by the buffer that came out of the worker. No JSON.parse, no array of ten thousand {x, y} objects, no garbage collector pause in the middle of an interaction.
Observable Plot is the only charting library I know of that takes that seriously. Plot lets you pass parallel arrays — or Arrow vectors — directly as channels instead of demanding an array of row objects. So the typed array that came out of the worker goes into the mark unchanged. Every other layer in this stack is columnar; it would be strange to convert to rows at the last step just to please a chart library.
What you are deliberately not getting: fresh data (this is a nightly snapshot), row-level access control (see section 11 — this is the real constraint, and it disqualifies the design for a lot of apps), and anything above roughly the tens-of-millions-of-rows mark on a laptop. What you are getting is a dashboard where a new question is a SQL string in a component, not a ticket.
Prerequisites
- Nuxt 4.x (
4.2here) on Node 20.19+, with Vite 6 or 7 - Comfort with Web Workers and the idea that some code cannot run during SSR
- The DuckDB CLI for the data-prep step
- A deploy target that serves static files with
Accept-Ranges: bytes— a VPS, a container, a normal CDN. Section 2 shows how to check, and checking is not optional
npm i @duckdb/duckdb-wasm apache-arrow @observablehq/plot
apache-arrow is a peer of @duckdb/duckdb-wasm rather than a bundled copy. Install it explicitly and pin one version — two copies of Arrow in a bundle produces instanceof failures that are genuinely miserable to debug, because the objects look identical in the console.
1) Build a Parquet file that is worth range-requesting
Any Parquet file will work. A Parquet file written with the query in mind will work about twenty times better, and the difference is two clauses.
scripts/build-dataset.sql:
SELECT setseed(0.42);

COPY (
  WITH base AS (
    SELECT
      CAST(floor(random() * 150) AS INTEGER) AS day,
      random() AS r1, random() AS r2, random() AS r3, random() AS r4,
      random() AS r5, random() AS r6, random() AS r7, random() AS r8
    FROM range(0, 5000000)
  )
  SELECT
    TIMESTAMP '2026-01-01 00:00:00' + to_days(day)
      + to_minutes(CAST(floor(1440 * CASE
          -- two commute humps and a flat background
          WHEN r1 < 0.32 THEN least(greatest((7.8 + 2.2 * (r2 + r3 - 1)) / 24, 0), 0.999)
          WHEN r1 < 0.72 THEN least(greatest((17.1 + 2.6 * (r2 + r3 - 1)) / 24, 0), 0.999)
          ELSE r2
        END) AS INTEGER))                                          AS started_at,
    CAST(round(90 + 2100 * (-ln(1 - r4))) AS INTEGER)              AS duration_s,
    round(0.4 + 3.0 * (-ln(1 - r5)), 2)                            AS distance_km,
    ['Kungsholmen', 'Södermalm', 'Vasastan', 'Östermalm',
     'Gamla stan', 'Norrmalm', 'Hammarby', 'Årsta'
    ][1 + CAST(floor(r6 * 8) AS INTEGER)]                          AS start_zone,
    r7 < 0.78                                                      AS is_member,
    ['sthlm', 'gbg', 'malmo'][1 + CAST(floor(r8 * 3) AS INTEGER)]  AS city
  FROM base
  ORDER BY started_at
) TO 'public/data/trips-v1.parquet' (
  FORMAT parquet,
  COMPRESSION zstd,
  ROW_GROUP_SIZE 100000
);
Use real data if you have it. The reason this generator is more elaborate than i % 24 is that degenerate synthetic data will lie to you about every number in this article. A file built from arithmetic on a counter has a handful of distinct values per column, Parquet's dictionary and RLE encodings compress it to nothing, and you'll conclude that 5M rows fit in 3 MB and that range requests are pointless. Log-normal durations and a bimodal start time behave like the real thing: 5 million rows, eight columns' worth of entropy, 23.5 MB on disk.
mkdir -p public/data
duckdb -c ".read scripts/build-dataset.sql"
Three decisions in there matter.
ORDER BY started_at. Parquet stores min/max per column per row group. If rows are in random time order, every row group's started_at range spans the whole dataset, every range overlaps your filter, and nothing can be skipped — you fetch the entire file to answer "trips in March". Sorted, each row group covers a narrow slice of time and DuckDB skips the rest from the footer alone. This is the single highest-leverage line in the whole tutorial. Sort by whatever your users filter on most; you get one such column, so choose it deliberately.
ROW_GROUP_SIZE 100000. DuckDB's default is 122,880 rows. Smaller groups mean finer-grained skipping but a fatter footer and more HTTP requests; larger groups mean the opposite. Somewhere around 100k is a reasonable middle for a file you intend to range-request over a network rather than read off a local SSD. Don't drop to 10k thinking finer is better — you'll turn one 1 MB fetch into two hundred round trips, and on a 60 ms RTT connection the latency dwarfs the bytes you saved.
COMPRESSION zstd. Better ratio than snappy at decompression speeds that are irrelevant next to the network. Note this is page compression inside the file, which is what preserves seekability — this is not the same thing as Content-Encoding: gzip on the response, which would destroy it. More on that in a moment.
Check what you got. parquet_metadata() returns one row per column per row group, which trips people up — count distinct row group ids, not rows:
duckdb -c "
  SELECT count(DISTINCT row_group_id) AS row_groups
  FROM parquet_metadata('public/data/trips-v1.parquet');

  SELECT path_in_schema,
         round(sum(total_compressed_size) / 1e6, 2) AS mb
  FROM parquet_metadata('public/data/trips-v1.parquet')
  GROUP BY 1 ORDER BY 2 DESC;"
┌──────────────┬───────┐
│ path_in_schema │  mb   │
├──────────────┼───────┤
│ duration_s   │  9.82 │
│ distance_km  │  7.08 │
│ start_zone   │  1.90 │
│ started_at   │  1.71 │
│ city         │  1.02 │
│ is_member    │  0.49 │
└──────────────┴───────┘
That table is the whole argument for this architecture, so it's worth doing the arithmetic. Take a representative dashboard query — trips by zone, March only, members only. It touches three columns: started_at, start_zone, is_member. That's 4.10 MB of the 23.5 MB file. March is one month of five, and because the file is sorted, exactly 11 of the 50 row groups overlap that range:
duckdb -c "
  SELECT count(*) AS groups_touched FROM (
    SELECT row_group_id, min(stats_min_value) mn, max(stats_max_value) mx
    FROM parquet_metadata('public/data/trips-v1.parquet')
    WHERE path_in_schema = 'started_at'
    GROUP BY 1
  ) WHERE mn <= '2026-04-01' AND mx >= '2026-03-01';"
4.10 MB × 11/50 ≈ 0.9 MB, out of 23.5. Projection pushdown gives you about 5.7×, row-group pruning another 4.5×, and they multiply. Unsort the file and the second factor vanishes entirely — that's what ORDER BY is buying.
The -v1 in the filename is not decoration. It's the cache key — see section 2.
A note on partitioning, and why it doesn't work here
The obvious next move is PARTITION_BY (city) to get a Hive-partitioned directory tree, and then read_parquet('data/**/*.parquet'). Over a local filesystem that's excellent. Over HTTP it does not work, because globbing requires directory listing and HTTP has no such thing. If you want multiple files you have to enumerate them yourself:
SELECT * FROM read_parquet([
  '/data/trips-2026-01-v1.parquet',
  '/data/trips-2026-02-v1.parquet'
]);
Which is fine, and is actually a good pattern for time-partitioned data where the client knows the date range up front — you skip whole files without reading their footers. Just generate the list in TypeScript from your filter state rather than hoping a glob will resolve.
2) Serve it so ranges actually work
Nuxt serves public/ through Nitro, so the file is already at /data/trips-v1.parquet. Add a cache rule:
// nuxt.config.ts
export default defineNuxtConfig({
  routeRules: {
    '/data/**': {
      headers: {
        'cache-control': 'public, max-age=31536000, immutable',
      },
    },
  },
})
immutable is safe precisely because the version is in the filename. Rebuild the dataset, bump to trips-v2.parquet, change one constant in the app. Never mutate a file that has been served with that header — you will be chasing a stale cache on someone else's laptop for a week.
Now verify range support, because everything downstream depends on it:
curl -s -D - -o /dev/null -r 0-1023 http://localhost:3000/data/trips-v1.parquet
You want to see:
HTTP/1.1 206 Partial Content
Accept-Ranges: bytes
Content-Range: bytes 0-1023/23490775
Content-Length: 1024
If you get HTTP/1.1 200 OK and a Content-Length equal to the whole file, DuckDB will download all 23.5 MB for every single query and you will conclude, wrongly, that this technique is slow. Three things commonly cause it:
- A compressing proxy. If Nginx or a CDN applies
Content-Encoding: gzipto the response, the byte offsets DuckDB computed from the footer no longer address anything meaningful, and well-behaved servers respond with the whole entity instead. Parquet is already compressed; make sure.parquet/application/octet-streamis not in yourgzip_types. Some CDNs also stripAccept-Rangeswhen they compress — test against production, not just localhost. - Cloudflare-style transforms on the free tier, which can buffer and re-encode. Serve data files from a path excluded from optimisation features.
- A hand-rolled Nitro handler that reads the file and returns a buffer.
readFile+sendhas no idea whatRangemeans. If you must serve the file from a handler (see section 11 for why you might), you have to implement 206 yourself.
Cross-origin hosting — S3, R2, a separate CDN domain — needs CORS, and needs more of it than people expect:
Access-Control-Allow-Origin: https://app.example.com
Access-Control-Allow-Methods: GET, HEAD
Access-Control-Allow-Headers: Range
Access-Control-Expose-Headers: Content-Length, Content-Range, Accept-Ranges, ETag
Expose-Headers is the one that gets missed. DuckDB reads Content-Length off a HEAD to size the file; if the browser hides that header from the JS context, instantiation fails with an error that says nothing about CORS.
3) Instantiate DuckDB-Wasm inside Nuxt
Two config lines first:
// nuxt.config.ts
export default defineNuxtConfig({
  vite: {
    optimizeDeps: {
      exclude: ['@duckdb/duckdb-wasm'],
    },
  },
})
Vite's dependency pre-bundler will otherwise rewrite @duckdb/duckdb-wasm into a single optimised chunk and lose the sibling .wasm and worker files that the package needs to resolve at runtime. Excluding it costs you a slightly slower cold dev start and saves you an afternoon.
Next, the bundle map. DuckDB ships several builds — mvp (baseline Wasm), eh (exception handling, faster and better errors), and coi (threads, requires cross-origin isolation; section 9). selectBundle() feature-detects and picks one, so you hand it URLs for the candidates and let it choose.
// app/lib/duckdb-bundles.ts
import type { DuckDBBundles } from '@duckdb/duckdb-wasm'
import mvpWasm from '@duckdb/duckdb-wasm/dist/duckdb-mvp.wasm?url'
import mvpWorker from '@duckdb/duckdb-wasm/dist/duckdb-browser-mvp.worker.js?url'
import ehWasm from '@duckdb/duckdb-wasm/dist/duckdb-eh.wasm?url'
import ehWorker from '@duckdb/duckdb-wasm/dist/duckdb-browser-eh.worker.js?url'

export const BUNDLES: DuckDBBundles = {
  mvp: { mainModule: mvpWasm, mainWorker: mvpWorker },
  eh: { mainModule: ehWasm, mainWorker: ehWorker },
}
Note the directory: app/lib/, not app/utils/. Nuxt auto-imports everything in app/utils/, which would make this module statically reachable from your entry chunk. The ?url imports themselves are just strings, so the 35-ish MB of Wasm isn't downloaded — but the @duckdb/duckdb-wasm JS runtime is a few hundred kilobytes, and there's no reason for a visitor reading your blog to pay for it. Keeping the file out of the auto-import scan means the only way in is the dynamic import() below.
// app/composables/useDuckDb.ts
import type {
  AsyncDuckDB,
  AsyncDuckDBConnection,
} from '@duckdb/duckdb-wasm'

export interface DuckHandle {
  db: AsyncDuckDB
  conn: AsyncDuckDBConnection
}

let booting: Promise<DuckHandle> | null = null

async function boot(): Promise<DuckHandle> {
  const duckdb = await import('@duckdb/duckdb-wasm')
  const { BUNDLES } = await import('~/lib/duckdb-bundles')

  const bundle = await duckdb.selectBundle(BUNDLES)
  const worker = new Worker(bundle.mainWorker!)
  const db = new duckdb.AsyncDuckDB(new duckdb.VoidLogger(), worker)
  await db.instantiate(bundle.mainModule, bundle.pthreadWorker)

  await db.open({
    query: {
      castBigIntToDouble: true,
      castTimestampToDate: true,
    },
  })

  const url = new URL('/data/trips-v1.parquet', location.origin).href
  await db.registerFileURL(
    'trips.parquet',
    url,
    duckdb.DuckDBDataProtocol.HTTP,
    false,
  )

  const conn = await db.connect()
  await conn.query(`
    CREATE OR REPLACE VIEW trips AS
    SELECT * FROM read_parquet('trips.parquet')
  `)

  return { db, conn }
}

export function useDuckDb(): Promise<DuckHandle> {
  if (import.meta.server) {
    throw new Error('useDuckDb() is client-only — guard with import.meta.client')
  }
  booting ??= boot()
  return booting
}
Several things are load-bearing here.
The two query config flags are not optional. By default DuckDB's BIGINT — which is what count(*) returns — arrives in JavaScript as a BigInt, and TIMESTAMP arrives as a raw microsecond count. Feed a BigInt to Observable Plot and you get TypeError: Cannot mix BigInt and other types, use explicit conversions from deep inside a d3 scale, which is a wonderfully unhelpful place to start debugging. castBigIntToDouble and castTimestampToDate make DuckDB emit double and Date instead, at the cost of precision above 2^53 — irrelevant for counts, something to think about if you're summing cents across a billion rows.
VoidLogger, not ConsoleLogger. The docs use ConsoleLogger and it will happily log every query, every file range fetch and every buffer registration. It's genuinely useful while you're getting ranges working; leave it on in production and the console becomes unreadable.
booting ??= boot() is the whole concurrency story. Every component that wants data calls useDuckDb(), and they all await the same promise. One worker, one Wasm instance, one 35 MB download per page load — not one per chart.
The view is free. CREATE VIEW doesn't read the file. Nothing is fetched until the first real query, so this whole boot() costs one HEAD request.
If new Worker(bundle.mainWorker!) throws Cannot use import statement outside a module, your bundler resolved an ESM build of the worker; pass { type: 'module' } as the second argument. Whether you need it depends on the version and how Vite emitted the asset, so treat it as the first thing to try rather than a rule.
4) A query layer that survives fast fingers
You could stop here and call conn.query(sql) from components. Don't — for three reasons that all bite within an hour of real use.
A DuckDB-Wasm connection processes one query at a time. Five charts firing simultaneously on one connection interleave badly. Rebuilding a SQL string on every keystroke re-parses and re-plans a query whose shape never changes. And a user dragging a slider generates ten queries whose results arrive out of order, so the chart settles on whichever one happened to finish last.
All three are solved by about forty lines.
// app/composables/useDuckQuery.ts
import type { Table } from 'apache-arrow'
import type { AsyncPreparedStatement } from '@duckdb/duckdb-wasm'

const cache = new Map<string, Promise<AsyncPreparedStatement>>()
let chain: Promise<unknown> = Promise.resolve()

/** Serialises access to the single connection and reuses prepared plans. */
export async function duckQuery(
  sql: string,
  params: readonly unknown[] = [],
): Promise<Table> {
  const run = chain.then(async () => {
    const { conn } = await useDuckDb()

    let stmt = cache.get(sql)
    if (!stmt) {
      stmt = conn.prepare(sql)
      cache.set(sql, stmt)
    }

    return (await stmt).query(...params)
  })

  // Keep the chain alive even if this query rejects.
  chain = run.catch(() => {})
  return run
}
Prepared statements do double duty here. They skip re-planning, and they're the reason user-supplied filter values never touch a SQL string. That second point deserves emphasis: this is client-side SQL, but it is not therefore harmless. A user can already run any query they like against their own copy of the data — that's the design. What string interpolation buys you is a bug where a zone name containing an apostrophe crashes the dashboard, and a shareable URL whose filter parameters can rewrite the query for whoever opens the link. Parameters, always.
Note what parameters can't do: they bind values, not identifiers. GROUP BY ? is not a thing. Dynamic grouping columns need an allowlist:
const GROUPABLE = ['start_zone', 'city', 'is_member'] as const
type Groupable = (typeof GROUPABLE)[number]

function groupColumn(input: string): Groupable {
  const found = GROUPABLE.find(c => c === input)
  if (!found) throw new Error(`Not a groupable column: ${input}`)
  return found
}
Now the reactive wrapper, with the stale-result guard:
// app/composables/useDuckAggregate.ts
import type { Table } from 'apache-arrow'

export function useDuckAggregate(
  build: () => { sql: string, params: readonly unknown[] },
) {
  const data = shallowRef<Table | null>(null)
  const pending = ref(false)
  const error = ref<Error | null>(null)
  let token = 0

  watchEffect(async () => {
    if (import.meta.server) return
    const { sql, params } = build()
    const mine = ++token
    pending.value = true

    try {
      const table = await duckQuery(sql, params)
      if (mine !== token) return // a newer query won
      data.value = table
      error.value = null
    }
    catch (e) {
      if (mine !== token) return
      error.value = e as Error
    }
    finally {
      if (mine === token) pending.value = false
    }
  })

  return { data, pending, error }
}
shallowRef, not ref. An arrow.Table is a tree of vectors over ArrayBuffers, and making it deeply reactive means Vue walks every one of them installing proxies. It's slow, it's pointless — the table is immutable — and the proxies then leak into Plot, which does instanceof checks that a Proxy will fail. Any time an Arrow table, a typed array or a Plot figure lands in Vue state, shallowRef is the correct choice.
The token counter is the same trick as a monotonic version on a streamed job — see the background job queue build for the server-side sibling of this idea. Cheap, and it removes an entire class of "the chart flickers back to the old filter" bug.
5) Arrow straight into Observable Plot
Here's the part that makes the whole stack worth assembling.
The conventional path from a query result to a chart is: rows → JSON → array of objects → chart library reads d.x and d.y for every point. For a 10,000-point scatter that's 10,000 object allocations and 20,000 property lookups, per render.
Plot accepts a different input form. If you give it { length: n } as the data and pass arrays as channels, it reads the arrays directly:
// app/lib/arrow.ts
import type { Table } from 'apache-arrow'

/** Numeric column as a typed array, ready to be a Plot channel. */
export function col<T = number>(table: Table, name: string): ArrayLike<T> {
  const child = table.getChild(name)
  if (!child) throw new Error(`No column "${name}" in result`)
  return child.toArray() as ArrayLike<T>
}

/** Rows as plain objects — for tables and tooltips, not for charts. */
export function rows<T>(table: Table): T[] {
  return table.toArray().map(r => r.toJSON() as T)
}
Two functions, and the comment on each is the important part. col() on a DOUBLE, INTEGER or FLOAT column hands back a Float64Array / Int32Array over the buffer the worker produced. rows() exists because table.toArray() returns StructRow proxies rather than plain objects — perfectly usable, but they don't survive structuredClone, they confuse JSON.stringify in subtle ways with nested types, and they're not something you want in Vue state. .toJSON() flattens each one. Use it for a details table; never for a chart.
The chart component:
<!-- app/components/PlotFigure.vue -->
<script setup lang="ts">
import * as Plot from '@observablehq/plot'

const props = defineProps<{
  options: Plot.PlotOptions | null
}>()

const host = useTemplateRef<HTMLDivElement>('host')
let figure: (SVGSVGElement | HTMLElement) | null = null

function render() {
  if (!host.value) return
  figure?.remove()
  figure = null
  if (!props.options) return
  figure = Plot.plot(props.options)
  host.value.append(figure)
}

watch(() => props.options, render, { flush: 'post' })
onMounted(render)
onBeforeUnmount(() => figure?.remove())
</script>

<template>
  <div ref="host" class="min-h-56 w-full" />
</template>
Plot builds a detached SVG element and hands it to you; it is not a Vue component and doesn't want to be. Mount it imperatively, remove the previous one, done. flush: 'post' so the DOM node exists when the watcher fires.
And a chart:
<!-- app/components/TripsByHour.vue -->
<script setup lang="ts">
import * as Plot from '@observablehq/plot'

const props = defineProps<{
  where: { sql: string, params: readonly unknown[] }
}>()

const { data, pending } = useDuckAggregate(() => ({
  sql: `
    SELECT hour(started_at)::INTEGER AS hour,
           count(*)                  AS trips
    FROM trips
    WHERE ${props.where.sql}
    GROUP BY 1
    ORDER BY 1
  `,
  params: props.where.params,
}))

const options = computed<Plot.PlotOptions | null>(() => {
  const t = data.value
  if (!t) return null

  return {
    height: 220,
    marginLeft: 56,
    x: { label: 'Hour of day', tickFormat: '02d' },
    y: { label: 'Trips', grid: true },
    marks: [
      Plot.barY({ length: t.numRows }, {
        x: col(t, 'hour'),
        y: col(t, 'trips'),
        fill: 'currentColor',
        tip: true,
      }),
      Plot.ruleY([0]),
    ],
  }
})
</script>

<template>
  <figure :class="pending ? 'opacity-60 transition-opacity' : ''">
    <figcaption class="mb-2 text-sm font-medium">
      Trips by hour of day
    </figcaption>
    <PlotFigure :options="options" />
  </figure>
</template>
{ length: t.numRows } is the columnar form. col(t, 'hour') and col(t, 'trips') are typed arrays. Nothing between the worker and the SVG allocates a row object.
fill: 'currentColor' is worth stealing if you support dark mode — Plot inherits the CSS colour, so the chart follows your theme without a watch on the colour mode. And note that this query returns 24 rows. That's the discipline the whole design rests on: the browser holds five million rows, but the thing that reaches a chart is always an aggregate. SELECT * into the client is how you get back to the frozen tab.
6) Cross-filtering, which is where this stops being a parlour trick
A shared filter object, one builder, five charts.
// app/composables/useTripFilters.ts
export interface WhereClause {
  sql: string
  params: readonly unknown[]
}

export const useTripFilters = () => {
  const from = useState('f.from', () => '2026-01-01')
  const to = useState('f.to', () => '2026-06-01')
  const city = useState<string | null>('f.city', () => null)
  const zone = useState<string | null>('f.zone', () => null)
  const membersOnly = useState('f.members', () => false)

  const where = computed<WhereClause>(() => {
    const parts = ['started_at >= ?::TIMESTAMP', 'started_at < ?::TIMESTAMP']
    const params: unknown[] = [from.value, to.value]

    if (city.value) {
      parts.push('city = ?')
      params.push(city.value)
    }
    if (zone.value) {
      parts.push('start_zone = ?')
      params.push(zone.value)
    }
    if (membersOnly.value) {
      parts.push('is_member')
    }

    return { sql: parts.join(' AND '), params }
  })

  function toggleZone(next: string) {
    zone.value = zone.value === next ? null : next
  }

  return { from, to, city, zone, membersOnly, where, toggleZone }
}
The sql string is built only from literals in this file; every user value goes through params. That invariant is easy to hold if the builder is the only place a WHERE clause is ever assembled, and easy to lose the moment someone adds a "custom filter" text box.
Because the SQL shape is stable across filter changes — the same string with different parameters — the prepared-statement cache in duckQuery hits every time. Only the first render of each chart pays for planning.
Making a bar clickable is the one place I'd push back on the obvious approach. Plot has no click channel; the documented interaction story is Plot.pointer for tooltips and crosshairs, not selection. You can attach a listener to the returned SVG and read __data__ off the target — and with columnar input, __data__ is the row index, not your value, which is its own small trap.
Don't. Render the selectable dimension as ordinary HTML next to the chart:
<ul class="mt-3 flex flex-wrap gap-2">
  <li v-for="(name, i) in zones" :key="name">
    <button
      type="button"
      class="rounded-full border px-3 py-1 text-sm"
      :class="zone === name ? 'border-emerald-500 bg-emerald-500/10' : 'border-transparent'"
      :aria-pressed="zone === name"
      @click="toggleZone(name)"
    >
      {{ name }} · {{ counts[i] }}
    </button>
  </li>
</ul>
A twelve-row bar chart does not need to be an input when there's a perfectly good <ul> right there. You get focus order, aria-pressed, keyboard activation and a visible focus ring for free, instead of reimplementing all four badly on <rect> elements. The chart stays a chart.
The payoff is in the timings. Change the city filter and five queries run against data already in the tab. On an M-series laptop the aggregates in this build land in the low tens of milliseconds each once the relevant row groups are cached, and the first cold query on a narrow date range fetches under a megabyte rather than the whole 23.5 MB. The equivalent server round trip is five requests and a hundred milliseconds of network before the database has done anything at all.
Numbers on your data will differ — measure, don't trust mine. Which brings us to how.
7) Measuring, and the three things that make it slow
DuckDB's profiler works in Wasm:
const { conn } = await useDuckDb()
const plan = await conn.query(`EXPLAIN ANALYZE
  SELECT start_zone, count(*) FROM trips
  WHERE started_at >= TIMESTAMP '2026-03-01' GROUP BY 1`)
console.log(plan.toArray()[0]!.toJSON())
Read the PARQUET_SCAN node. It reports how many row groups it touched. If a narrow date filter touches all of them, your file isn't sorted — go back to section 1.
Then open the network panel and look at the requests to trips-v1.parquet. You should see a small flurry of 206s. Three failure modes to recognise:
Every query refetches the same ranges. DuckDB-Wasm caches fetched blocks in memory, but a hard reload clears it and so does creating a new AsyncDuckDB. If you're seeing repeat fetches within a session, you've probably instantiated more than one database — check that booting ??= is actually memoising and that HMR isn't re-running the module. In dev, a if (import.meta.hot) import.meta.hot.dispose(() => { booting = null }) avoids leaking a worker per hot update.
One enormous request instead of many small ones. That's a 200 dressed up as success. Section 2.
SELECT * in a view or subquery. Parquet's projection pushdown only helps if the columns are actually unused. CREATE VIEW trips AS SELECT * FROM read_parquet(...) is fine because DuckDB pushes the projection through the view — but the moment you materialise (CREATE TABLE … AS SELECT *), you've read every column. If a dashboard only ever touches four of your twelve columns, the other eight should never leave the server.
Once you've confirmed all that, the biggest remaining win is to stop going to the network entirely for a hot subset:
await conn.query(`
  CREATE OR REPLACE TABLE trips_recent AS
  SELECT started_at, duration_s, distance_km, start_zone, is_member, city
  FROM trips
  WHERE started_at >= TIMESTAMP '2026-05-01'
`)
Now that slice lives in Wasm memory and queries against it never touch HTTP. The cost is real memory in a 32-bit address space — see section 11 before you get enthusiastic.
8) Server-side rendering, and what to do about the empty first paint
None of this runs during SSR. The honest version of that sentence is that a user on a cold cache sees a layout, then waits for a Wasm module measured in tens of megabytes, then sees numbers. That's an acceptable trade for an internal tool and a bad one for anything public-facing.
The fix is pleasing, because it's the same SQL against a different engine. Nitro can run real DuckDB on the same Parquet file — it's sitting in public/data/ on the server's disk:
npm i @duckdb/node-api
// server/api/trips/summary.get.ts
import { DuckDBInstance } from '@duckdb/node-api'
import { z } from 'zod'

const Query = z.object({
  from: z.iso.date(),
  to: z.iso.date(),
})

let instance: Promise<DuckDBInstance> | null = null

export default defineEventHandler(async (event) => {
  const { from, to } = await getValidatedQuery(event, Query.parse)

  instance ??= DuckDBInstance.create(':memory:')
  const conn = await (await instance).connect()

  const reader = await conn.runAndReadAll(
    `SELECT count(*)::INTEGER              AS trips,
            median(duration_s)::DOUBLE     AS median_s,
            quantile_cont(duration_s, 0.95)::DOUBLE AS p95_s
     FROM read_parquet('public/data/trips-v1.parquet')
     WHERE started_at >= $1::TIMESTAMP AND started_at < $2::TIMESTAMP`,
    [from, to],
  )

  setHeader(event, 'cache-control', 'public, max-age=300, s-maxage=3600')
  return reader.getRowObjects()[0]
})
@duckdb/node-api is a native module, so Nitro has to leave it alone:
// nuxt.config.ts
export default defineNuxtConfig({
  nitro: {
    externals: {
      external: ['@duckdb/node-api'],
    },
  },
})
Same pattern as keeping onnxruntime-node out of the Nitro bundle in the local semantic search build — any package with a .node binary needs it.
The page then does the obvious thing:
const { from, to } = useTripFilters()
const { data: summary } = await useFetch('/api/trips/summary', {
  query: { from, to },
})
KPI numbers render on the server and are correct in the HTML. The charts hydrate when the worker is ready. Note the explicit ::INTEGER and ::DOUBLE casts — the Node client has the same BIGINT → BigInt behaviour as the Wasm one, and BigInt does not survive JSON serialisation across the Nitro boundary. useFetch will throw on it, at runtime, in a stack trace that mentions neither DuckDB nor BigInt.
One endpoint, deliberately cacheable, instead of five. That's the compromise I'd actually ship.
9) Threads, and why you probably shouldn't
DuckDB's coi bundle uses SharedArrayBuffer and pthreads for genuine parallel query execution. Getting it requires cross-origin isolation, which is two headers:
// nuxt.config.ts
export default defineNuxtConfig({
  routeRules: {
    '/dashboard/**': {
      headers: {
        'cross-origin-opener-policy': 'same-origin',
        'cross-origin-embedder-policy': 'require-corp',
      },
    },
  },
})
Scoping it to a route rather than /** matters, because cross-origin isolation is per-document and it is contagious: under require-corp, every cross-origin subresource the page loads must opt in with Cross-Origin-Resource-Policy or proper CORS. In practice that means your third-party fonts, your analytics snippet, your embedded video, your avatars from a CDN and your Sentry loader all stop working, silently, one at a time. Confining it to /dashboard/** keeps the blast radius to the one route that benefits.
Even then: I'd start with eh and single-threaded. A 5M-row hash aggregate over four columns is not where your latency is — the network is, and threads don't help with the network. Reach for coi when the profiler says the scan is CPU-bound, which for a dashboard-shaped workload it usually isn't.
10) Persistence with OPFS
If your users come back to the same dataset repeatedly, DuckDB-Wasm can keep a database file in the Origin Private File System instead of rebuilding it in memory every load:
await db.open({
  path: 'opfs://trips.db',
  accessMode: duckdb.DuckDBAccessMode.READ_WRITE,
  query: { castBigIntToDouble: true, castTimestampToDate: true },
})
Then CREATE TABLE trips AS SELECT * FROM read_parquet('trips.parquet') once, and subsequent visits skip the download entirely. It's a genuinely nice upgrade for a tool people use daily.
It also comes with a list. OPFS has been broadly available since 2023 but the DuckDB integration is newer and has sharper edges than the in-memory path — file handle errors after the user clears site data are a known class of bug, and you need a try/catch that falls back to :memory: rather than a white screen. Storage is subject to eviction under pressure, so treat it as a cache and keep the Parquet URL as the source of truth. And it's per-origin per-browser, so it does nothing for a first visit, which is the load you were actually worried about.
My rule: ship in-memory first, add OPFS when you have evidence that repeat visits are common.
11) Where this breaks
Wasm memory. DuckDB-Wasm is a 32-bit build, so the hard ceiling is 4 GB of address space, and browsers will fail an allocation long before that — mobile Safari especially, where a tab that asks for a gigabyte gets killed without a catchable error. Streaming aggregates over Parquet are fine because DuckDB processes in vectors and never holds the table. CREATE TABLE … AS SELECT * over five million rows is where you meet the limit. If you materialise, materialise a slice.
Cold start. The eh module is roughly 35 MB uncompressed — check the file in your node_modules for the current number — and a good fraction of that over the wire with Brotli. Serve it with content-encoding: br and a long cache, load it lazily on the route that needs it, and don't put a dashboard behind a link people click by accident.
Mobile. Twenty-odd megabytes of Parquet over cellular is rude, and a real dataset will be larger than this toy one. Ship a pre-aggregated file for small screens — daily rollups instead of individual trips is often a 100× size reduction and answers 90% of the questions — and switch on it.
Access control, which is the real one. The file is a static asset. Anyone who can load the dashboard can curl the whole dataset and open it in Excel. There is no row-level security, no column masking, no audit log. If the data is public or already visible to every user who can reach the page, that's not a problem — it's just an honest description of what a dashboard is. If different users are supposed to see different rows, this architecture is wrong and no amount of signed URLs will fix it. You can gate the file behind an authenticated Nitro handler, but then you're implementing 206 Partial Content yourself, and you still ship every authorised user everything they're authorised to see. Pre-render one Parquet file per tenant, or go back to an API.
Freshness. Immutable filenames mean the client sees whatever version it loaded. A nightly build with a version bump and a "data as of…" line in the UI is the honest presentation. Real-time is a different architecture — the Nitro WebSockets build is closer to what that wants.
Two copies of Arrow. Worth repeating because the symptom is so confusing: if apache-arrow appears twice in your lockfile, Table from one copy fails instanceof against the other and Plot silently treats your table as an opaque object. npm ls apache-arrow should print one line.
12) Where to take it
- Load the user's own file.
db.registerFileHandle(name, file, DuckDBDataProtocol.BROWSER_FILEREADER, true)with aFilefrom an<input type="file">gives you a drop-a-CSV-and-query-it tool in about fifteen lines. Nothing uploads anywhere, which is a genuine selling point for anything touching sensitive data. - Export the current filter.
COPY (…) TO 'out.parquet'writes into DuckDB's virtual filesystem;db.copyFileToBuffer('out.parquet')gets you the bytes, and aBlobdownload hands the user a filtered extract. A "download this view" button that costs four lines. - Push aggregation into a Nitro cache. For the handful of queries that every user runs identically, the type-safe data layer approach with a small cached endpoint beats making ten thousand browsers each compute the same number.
- Move the query loop off the main thread entirely. DuckDB already runs in its own worker, but the Arrow-to-Plot step doesn't. If you start rendering marks with 100k+ points, the Comlink and OffscreenCanvas patterns apply directly.
spatial, if your rows have coordinates. DuckDB's spatial extension loads in Wasm, andST_Withinagainst a drawn polygon feeding a Mapbox layer is the same architecture with a different last mile.- Generate the Parquet in CI. A nightly GitHub Action running the DuckDB CLI against your production replica, writing
trips-$(date +%Y%m%d).parquet, and committing a one-line manifest the app reads. The dashboard's "backend" becomes a cron job.
Wrapping up
Four files did the work: a bundle map, a boot function, a serialised query helper, and a chart component that appends an SVG. The dataset is a static asset. There is no /api/stats.
Three things to carry into your own build, whatever the stack. Sort the Parquet file by the column you filter on — it is one clause and it decides whether range requests are a clever trick or a real 25× saving. Set castBigIntToDouble and castTimestampToDate at db.open(), because the alternative is discovering DuckDB's type mapping one confusing runtime error at a time, in d3's stack frames. And keep the data columnar the whole way — Parquet to Arrow to Plot channels — because the moment you materialise rows to please a library, you've given back most of what this stack was for.
The wider point is that "the client can't do that" has been quietly false for a while. The browser has a working analytical database, a zero-copy columnar memory format, and a charting library that speaks it natively. The reason most dashboards still have five endpoints behind them is habit.
Sources
- DuckDB — Wasm client overview
- DuckDB — Wasm instantiation (Vite bundle map)
- DuckDB — Wasm data ingestion
- DuckDB-Wasm API —
DuckDBQueryConfig - DuckDB — Parquet tips and row groups
- DuckDB —
COPYstatement - Apache Arrow — JavaScript documentation
- Observable Plot — Marks and channels
- MDN — HTTP range requests
- MDN — Cross-Origin-Embedder-Policy
- MDN — Origin private file system
- Nuxt —
routeRules